Stop Staring at Charts: How AI Data Storytelling Unlocks True Insight
The Datum Fuse Team
July 31, 2025
In the world of data, we've become experts at creating visualizations. We build beautiful bar charts, intricate line graphs, and colorful pie charts. But a chart, no matter how well-designed, only completes half the journey. It shows you the "what"—a spike in sales, a dip in engagement, a shift in market share. It rarely tells you the "so what?".
That final, crucial step—transforming a visual into a clear, compelling narrative—is the essence of data storytelling. It's the bridge between raw data and an informed decision. And for most, it's a manual, time-consuming, and often difficult process.
Until now.
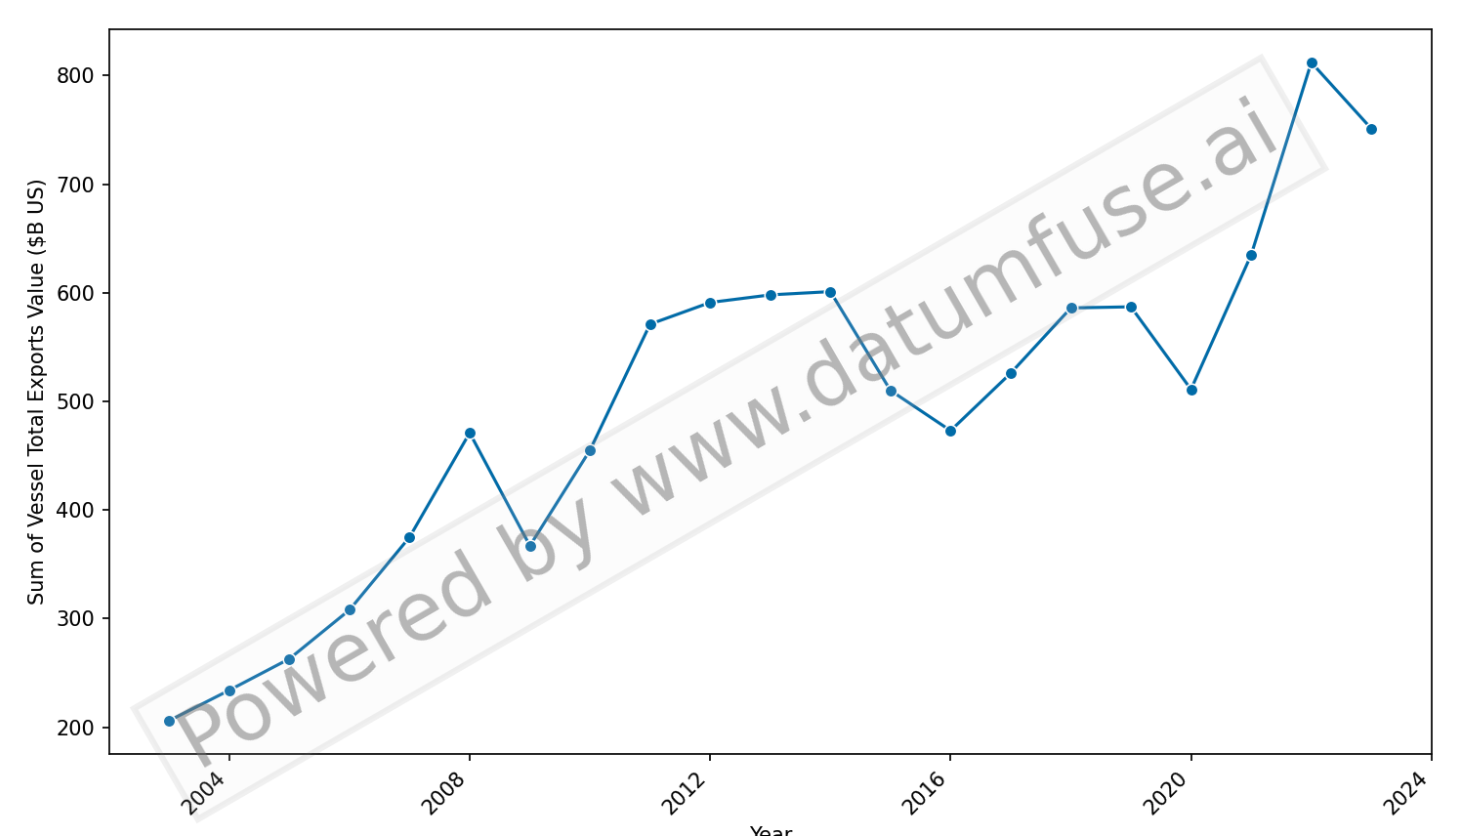 This chart is full of insights. But where do you even begin to explain it?
The Bottleneck: From Visualization to Interpretation
Manually analyzing a chart to write a summary involves a meticulous process:
- Identifying the primary trend or pattern.
- Pinpointing significant outliers or anomalies.
- Calculating key statistics and changes.
- Synthesizing all these points into a concise, human-readable paragraph.
This is the work of a skilled data analyst, and it takes time. But what if you could have an AI co-pilot to do this heavy lifting for you, instantly?
Introducing the Datum Fuse AI Data Storyteller
Our AI Data Storyteller is a revolutionary feature designed to act as your on-demand analyst. It integrates seamlessly with our visualization tools to close the loop on your analysis. With a single click, it analyzes your chart and generates a comprehensive, professional narrative.
The process is designed for maximum simplicity and impact.
Step 1: Visualize Your Data & Click "Generate"
First, use our Automated or Flexible Visualization tools to create your chart. Once your visual is ready, you'll see the magic button.
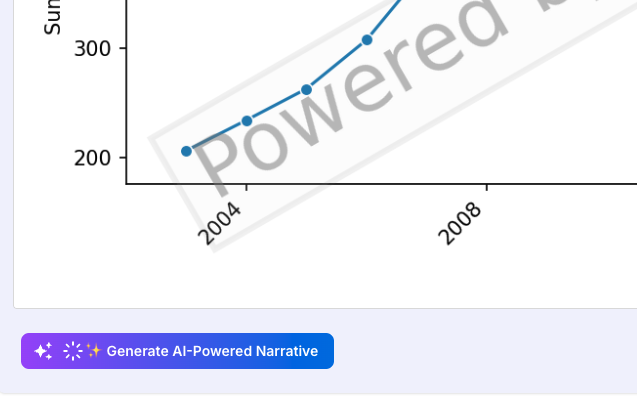
You don't need to write a prompt or provide any context. Just click "Generate AI-Powered Narrative."
Step 2: Receive Your Instant Data Story
In seconds, our AI analyzes every component of your chart—the axes, the data points, the trends, and the statistical properties. It then synthesizes this analysis into a complete, structured report.
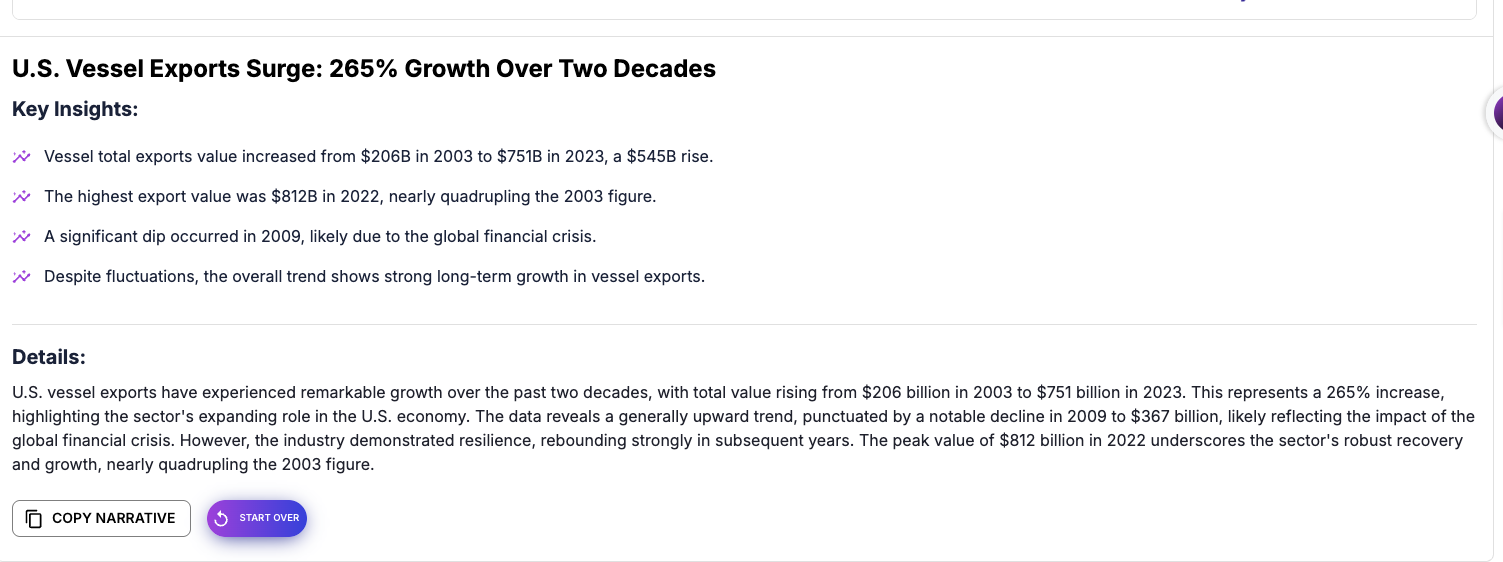
The AI-generated output is designed for clarity and action, providing you with:
- A Compelling Headline: A newspaper-style headline that summarizes the single most important finding in the chart.
- Key Insights (Bulleted List): A scannable list of the most significant trends, data points, and statistical callouts.
- A Detailed Narrative Paragraph: A well-written paragraph that weaves the key insights together into a coherent story, adding context and explaining the relationships in the data.
See the Full Process in Action
This 2-minute demo walks you through the entire workflow, from uploading a raw CSV to generating a chart and then creating a complete data story with a single click.
Click the image above to watch the full demo video.
Who is This For? How It Transforms Your Workflow
The ability to automate reporting and insight generation is a game-changer for a wide range of professionals.
For Marketers: Instantly generate summaries of campaign performance charts for your weekly reports. No more struggling to explain what that line graph means to your stakeholders.
For Business Analysts: Accelerate your exploratory data analysis. Quickly generate baseline narratives for multiple charts to identify which areas require deeper, manual investigation.
For Founders & Executives: Get to the bottom line, fast. Turn complex operational dashboards into clear, concise summaries that support rapid decision-making.
By automating the narrative, Datum Fuse frees you up to focus on the most valuable human skill: strategy. While the AI can tell you what happened, you now have more time to focus on why it happened and what your business should do next.
Stop just looking at charts. Start understanding, and sharing, the stories they tell.
Ready to turn your data into a story? Try the AI Data Storyteller for free.